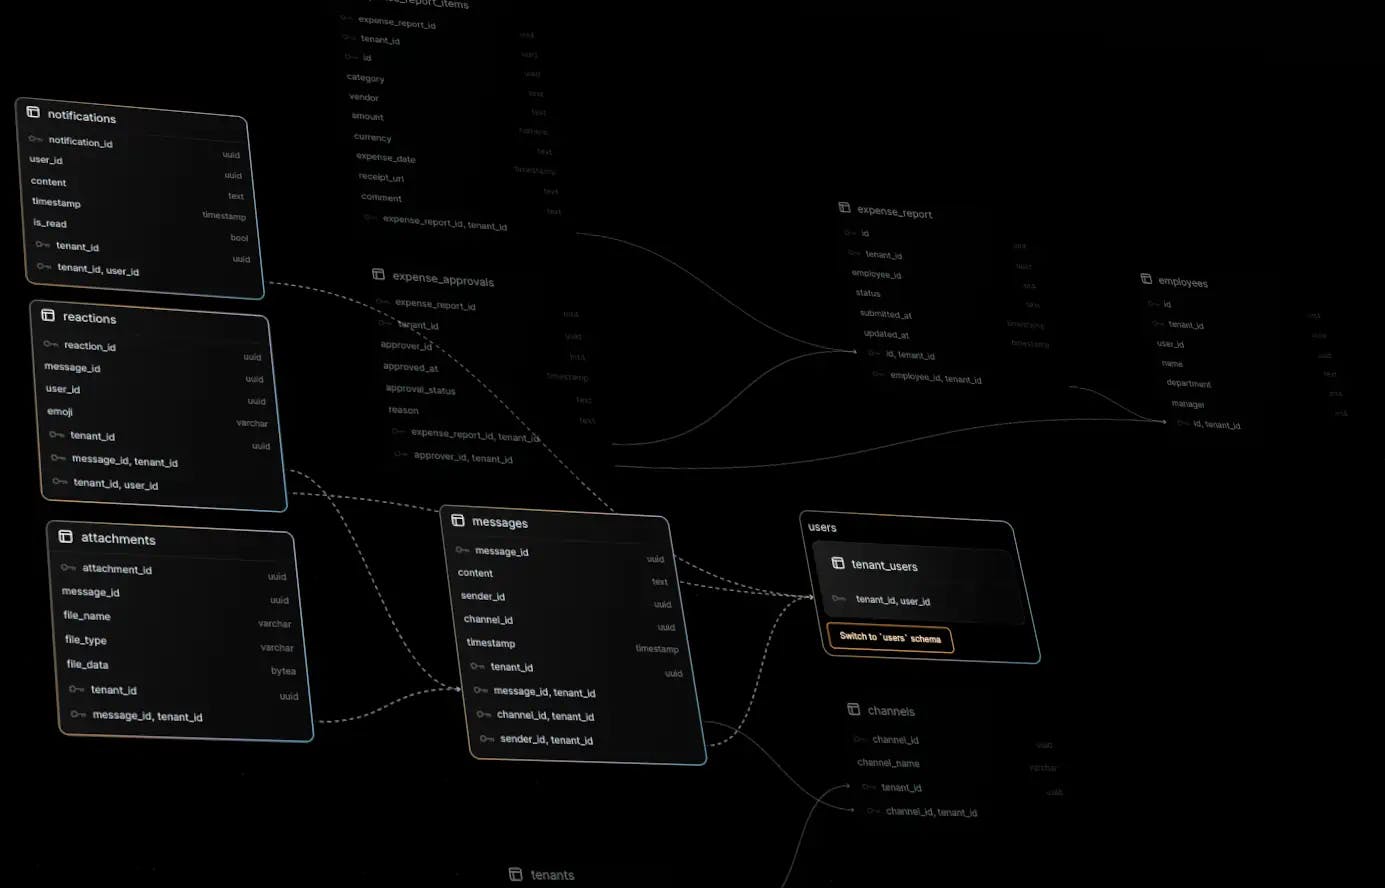
Visualizing Multitenant Data Flows in Serverless Postgres
Ever wondered how to gain deeper insights into your PostgreSQL database's structure and relationships? Picture this: you're handed a basket of seemingly random ingredients, and your challenge is to concoct a gourmet dish out of them. That's the essence of building a schema viewer for your database. From optimizing performance when querying and rendering database structures to visualizing a directional graph within the browser, we'll take you behind the scenes of Nile's schema visualization, revealing the intricacies of querying Postgres for essential data and serving up a delectable UI experience.
The meat and potatoes of Postgres relationships
The task begins with understanding what is available in Postgres to represent tables and relationships. The tables involved with that
are pg_class, pg_attribute and pg_constraint, which contain information about tables, columns, primary keys, and foreign keys.
To query for a list of tables:
SELECT
	c.relname as tablename,
	n.nspname as schemaname,
	c.oid as id
FROM pg_class c
JOIN pg_namespace n ON n.oid = c.relnamespace
WHERE n.nspname = 'public'
AND relkind in ('r', 'v', 'M');
It's important to get the oidfrom pg_class, as that will be the key for the data as we massage it into a way the browser can render it.
Specifically, the table id is used as the identifier for the nodes on the directional graph that will be rendered. More on that later.
Next, we get a list of columns:
SELECT
    a.attname as column_name,
    t.typname as data_type,
    c.relname as table_name
FROM pg_catalog.pg_class c
JOIN pg_catalog.pg_namespace n ON n.oid = c.relnamespace
JOIN pg_catalog.pg_attribute a ON a.attrelid = c.oid
JOIN pg_catalog.pg_type t ON t.oid = a.atttypid
WHERE a.attnum > 0 AND n.nspname = 'public';
In order to represent the relationship between the two queries, a simple for loop can be used to populate the tables with their columns.
Because the end result is a graph in the UI, and any column could connect to another, we derive a key from the table id and the index of the column
so that when it comes to connecting things together, we have a unique id for every entity. If all goes to plan, the data structure looks like this:
[
	{
		"tablename":"tenants",
		"schemaname":"public",
		"id": 19259,
		"columns":[{
				"column_name": "name",
				"data_type": "text",
				"id": "19259.0"
			},
			...
		]
	},
	...
]
Next, we go get the primary keys, so we can enrich the columns.
SELECT
	attname AS name,
	nspname AS schema,
	relname as table_name
FROM pg_catalog.pg_class c
JOIN pg_catalog.pg_namespace n ON n.oid = c.relnamespace
JOIN pg_catalog.pg_constraint con ON con.conrelid = c.oid
JOIN pg_catalog.pg_attribute a ON a.attrelid = c.oid
	AND a.attnum = ANY(con.conkey)
WHERE con.contype = 'p'
AND n.nspname = 'public';
After placing that data into our table array, the data now looks like this:
[
	{
		"tablename":"tenants",
		"schemaname":"public",
		"id": 19259,
		"columns":[ ... ],
		"primary_keys": [{
				"name":"id",
				"schema":"public",
				"table_name":"tenants"
			},
			...
		]
	},
	...
]
Now as to the foreign keys...
SELECT
  pg_constraint.oid as id,
  conname AS constraint_name,
  nsa.nspname AS source_schema,
  c.relname AS source_table,
  c.oid AS source_table_id, -- Internal pg id for the source table
  jsonb_agg(DISTINCT a.attname) AS source_columns,
  nso.nspname AS referenced_schema,
  c2.relname AS referenced_table,
  c2.oid AS referenced_table_id, -- Internal pg id for the referenced table
  jsonb_agg(DISTINCT af.attname) AS referenced_columns
FROM
  pg_constraint
JOIN
  pg_attribute AS a ON a.attnum = ANY(conkey) AND a.attrelid = conrelid
JOIN
  pg_attribute AS af ON af.attnum = ANY(confkey) AND af.attrelid = confrelid
JOIN
  pg_namespace AS nsa ON nsa.oid = connamespace and nsa.nspname
  NOT IN ('pg_catalog','information_schema')
JOIN
  pg_class AS c ON c.oid = conrelid
JOIN
  pg_class AS c2 ON c2.oid = confrelid
JOIN
  pg_namespace AS nso ON nso.oid = c2.relnamespace and nso.nspname
  NOT IN ('pg_catalog','information_schema')
WHERE
  contype = 'f'
GROUP BY
  pg_constraint.oid, conname, source_schema, source_table, source_table_id,
  referenced_schema, referenced_table, referenced_table_id, pg_constraint.conrelid,
  pg_constraint.confrelid;
One of the main issues when obtaining a list of foreign key constraints is the sheer slowness of the views in information_schema. A few things to note:
- Remember that making requests to the database will incur network latency. To limit this, limit the number of queries being requested.
- When possible, keep queries simple. If you must make a complex query to internal Postgres tables, prefer
pg_catalogtables overinformation_schema.
After all that, you get a data structure like this
[
	{
		"tablename": "tenants",
		"schemaname": "public",
		"id": 19259,
		"columns":[ ... ],
		"primary_keys":[ ... ],
		"relationships": [{
				"id": 19449,
				"constraint_name": "fake_tenant_fk",
				"source_schema": "public",
				"source_table": "expense_report",
				"source_table_id": 19441,
				"source_columns": ["employee_id","tenant_id"],
				"referenced_schema": "public",
				"referenced_table": "employees",
				"referenced_table_id": 19431,
				"referenced_columns": ["id","tenant_id"]
			},
			...
		]
	},
	...
]
Time to start cooking
Now that we have the data from Nile, we need to look back into our metaphorical basket of ingredients to see how we can handle the browser side of things. For this round, we have:
- A web server
- A directional graph
- Something to render a directional graph
For our dashboard at Nile, we use NextJS. To handle a complicated page like this, we can pre-load the data on page load.
When developing locally, everything was nice and fast, but once things were deployed to our dev environment, the performance was slow. Real slow. Watching grass grow slow. The machines we use in our internal development environment are not very powerful and I noticed a huge amount of time being spent in the data from Nile being returned. In lieu of spending more money, I figured a better bet would be to structure the code in a way to allow the page to render while still requesting data.
Initially on page load, I was waiting for the response to come back because there was no real latency locally. By adding a <Suspense/> to my page, NextJS will push chunks down to the browser while others work asynchronously to load and process.
In addition to the <Suspense/> , I added a function to force timeout for the requests on the page taking longer than expected. The error state will then force the client to query instead of the server, which allows me to show a loading indicator and possibly a stale graph if available.
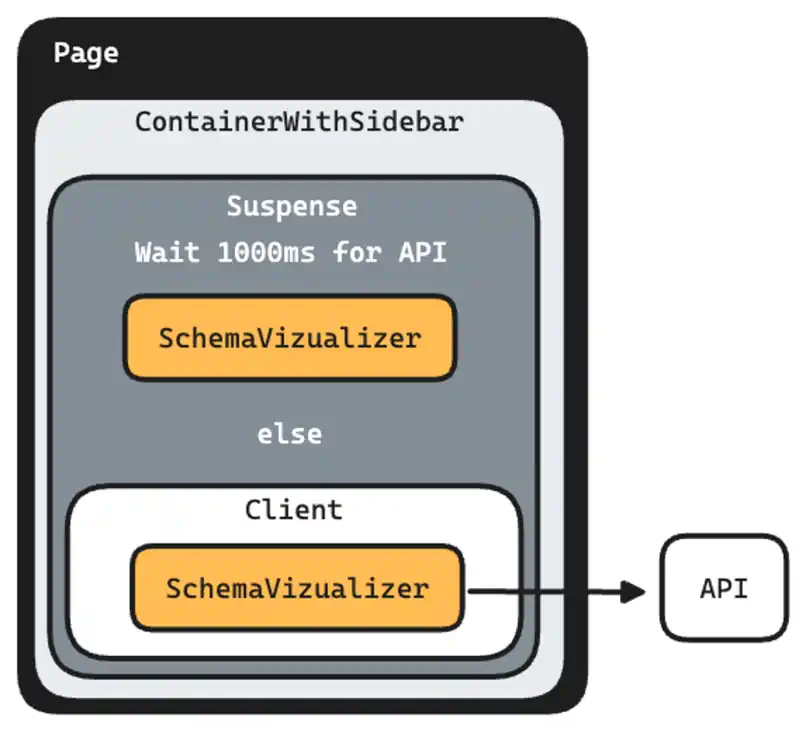
To button up all of the latency, schema graphs are saved to the browser’s database. Since I don’t really expect schemas to change all that much, it allows for instant rendering, provided the schema has been loaded by the client once, and allows me to re-use the client side request/render pattern again. The worst case is that the schema updates after loading completes. Best case is that nothing happens because the browser side and server side schemas are the same.
My internal component, <ContainerWithSidebar /> is rendered on the server, and because of <Suspense/>, the child component will either render server side or client side, based on latency.
// page.tsx
export default async function Page(props: Props) {
  // ship `<ContainerWithSidebar />` as fast as we can
  // use <Suspense /> to wait for things to happen
  return (
    <ContainerWithSidebar>
      <Suspense fallback={<CenteredCircularProgress />}>
        <SchemaVizPage {...props} />
      </Suspense>
    </ContainerWithSidebar>
  );
}

async function SchemaVizPage({ params }: { databaseName: string }) {
  // this is also run in the REST API - does auth things
  const runCommand = await commandSetup(params.databaseName);

  // wait as long as we want for schemas to come back, else error out
  const schemas = await waitForResponse({
    info,
    error,
    // get the initial set of data from the public schema - same as REST API
    fn: getSchemas({ schema: "public", runCommand }),
  }).catch(() => {
    return {
      error: true,
    };
  });

  // if an error is throw from `waitForResponse`, the `catch` will tell us
  // render the component, but force the client to request everything
  if (isObject(schemas) && "error" in schemas) {
    return <SchemaVisualizer initialTables={[]} fetchWithClient={true} />;
  }

  return <SchemaVisualizer initialTables={schemas} />;
}
With our web server able to handle the happy path, as well as the one that's not so great, we are now onto the second part of our recipe, the directional graph.
Makes you want to digraph
Don't be fooled, directional graphs are a nightmare. Even in the most simple case, there's a lot of stitching that needs done in order for it to appear. It’s the durian of our nightmare Chopped basket.
In addition, how bad (or good) it can be all of that depends on the library you choose to use. If we take some basic search params for github we find a lot of "that's a really long readme" repos, and latest commits from "7 years ago", "Is this project actively maintained" issues and "⛔ [DEPRECATED] - Graphs in JavaScript", which does not bode well for someone trying to make a directional graph.
But to be fair, in all honesty, it's probably rare to make these things, and even rarer to do it in React. So for what I've done in the past, there's only really library that I trust: elkjs. Yes, the bundled size is depressingly large. Yes it comes from Java land. Yes, it is made with GWT[https://www.gwtproject.org/], but for what ELK provides, it's pretty darn reasonable.
As to the implementation, the first thing we want to be sure to handle is the elkjs file. It’s huge. Like 2.1mb unminified huge, so always load it dynamically.
export default async function layout({ children, edges }) {
  const ELK = (await import("elkjs")).default; // <-- always do this so it does not clog up every page
  const elk = new ELK();
  return await elk.layout({
    children,
    edges,
    id: "root",
    layoutOptions: {
      algorithm: "layered",
      "spacing.nodeNodeBetweenLayers": "80.0",
      hierarchyHandling: "INCLUDE_CHILDREN",
    },
  });
}
After the initial setup, it's all about taking the data from the API and make it so that elkjs can handle it. If you're using typescript, this is straight forward:
- For
children, it's just a list of nodes with width and height. - For
edgesits just an object of sources and targets.
A slightly updated version from the elkjs readme:
import layout from "./layout";

const items = await layout({
  children: [
    { id: "n1", width: 30, height: 30 },
    { id: "n2", width: 30, height: 30 },
    { id: "n3", width: 30, height: 30 },
  ],
  edges: [
    { id: "e1", sources: ["n1"], targets: ["n2"] },
    { id: "e2", sources: ["n1"], targets: ["n3"] },
  ],
}).catch(console.error);
With this done, layout contains positional data (x, y coordinates) that will look good once rendered. Neat! But now we’ve come to our final problem we need to solve. How to render that stuff. For that, we can use reactflow
Now I will preface this by mentioning that I have run into issues in the past with enormous graphs where 200+ complicated SVG nodes being rendered and the browser dies from performance problems. I would not imagine this would happen in all but the most extreme cases. In those cases, you have to switch to a canvas based renderer, which we're not going to cover here. It is important to note, there is extra data from elkjs that helps with that (specifically the bend points in the edges), but SVGs are really easy to debug and have CSS, so the decision to use the canvas should really be thought through.
Setting up and running reactflow is easy enough, and we already have all the information we need from elkjs, so it's simply a matter mixing all the
ingredients together. For the sake of simplicity, you can see a very basic version of this:
import { ReactFlowProvider } from "reactflow";
// import "reactflow/dist/style.css";

function App() {
  const [nodes, setNodes] = React.useState([]);
  const [edges, setEdges] = React.useState([]);
  async function layout({ children, edges }) {
    // always do this so it does not clog up every page, but changed for illustrative purposes
    // const ELK = (await import("elkjs")).default;
    const elk = new ELK();
    return await elk.layout({
      children,
      edges,
      id: "root",
      layoutOptions: {
        algorithm: "layered",
        "spacing.nodeNodeBetweenLayers": "160.0",
        hierarchyHandling: "INCLUDE_CHILDREN",
      },
    });
  }
  React.useEffect(() => {
    (async () => {
      const items = await layout({
        children: [
          { id: "n1", width: 30, height: 30 },
          { id: "n2", width: 30, height: 30 },
          { id: "n3", width: 30, height: 30 },
        ],
        edges: [
          { id: "e1", sources: ["n1"], targets: ["n2"] },
          { id: "e2", sources: ["n1"], targets: ["n3"] },
        ],
      }).catch(console.error);
      setNodes(
        items.children.map((child) => ({
          ...child,
          data: {
            label: child.id
          },
          position: { x: child.x, y: child.y },
          sourcePosition: 'right',
          targetPosition: 'left',
        }))
      );
      setEdges(items.edges.map((edge)=>({
        ...edge,
        source: edge.sources[0],
        target: edge.targets[0],
      })))
    })();
  }, []);
  return <ReactFlow nodes={nodes} edges={edges} />;
}
So there we have it. With a little bit of Postgres magic and a basket if UI ingredients, we can cook up a schema viewer without too much problem.
Next Steps
Now that you know Nile’s secret recipe for visualizing database schema, you really should taste the result. It is super yummy, if we may say so ourselves. Join the waitlist and check it out.